Complete basketball stats guide: everything you need to know
The Complete Guide to Basketball Statistics
Every essential stat explained, with formulas and position-based benchmarks
Basketball statistics are no longer reserved for NBA teams and professional coaches. Whether you play in a club, in an amateur league, at the playground, or you just train alone on weekends, tracking your stats changes the way you improve. This guide is meant to become your reference: you will find every essential basketball stat, its formula, how to interpret it, and how it connects to the others.
The goal is not to drown you in numbers. The goal is to give you a clear reading grid that turns a 40-minute game into a list of concrete lessons: what you are doing well, what you are doing badly, and what you need to work on next time you are in the gym.
Why track your basketball stats
A player who measures nothing is flying blind. They can walk off the court thinking they had a "great game" because they hit a late three, while actually shooting 3-for-14 and losing six balls. Inversely, a player who defended hard, grabbed rebounds and moved the ball well can walk off frustrated when their impact was actually huge.
Basketball statistics correct that gap between feeling and reality. They give you three concrete benefits:
- Objective performance — you know what really happened, not what you think happened.
- Trend detection — a bad game happens. A bad month is a problem to fix.
- Work prioritization — if your free-throw percentage is 52%, you know exactly what to do tonight at the gym.
In this guide, we will cover the basic stats (points, rebounds, assists, steals, blocks), the shooting percentages, then the advanced stats. By the end, you will know which ones to prioritize based on your position and level.
Points: more than just a total
Points are the most visible stat, but also the most misleading. Scoring 20 points on 8-of-25 shooting is not the same as scoring 20 points on 8-of-12. Volume means nothing without efficiency.
Three sub-measures complete the raw total:
- Points per game (PPG) — the average over a season or cycle.
- Points per shot attempted (PPSA) — a simple proxy for offensive efficiency.
- Distribution by zone — how many came from the paint, mid-range, three-point line, and free throws.
A wing who scores 15 points with 9 in the paint and 6 at the line is a very different player from a wing who scores 15 points on five three-pointers. Tracking distribution tells you what kind of player you really are, beyond what you imagine.
Rebounds: offensive and defensive
Rebounds are the second most intuitive statistic. You always distinguish:
- Offensive rebounds (OREB) — you grab a teammate's missed shot. These create second-chance possessions.
- Defensive rebounds (DREB) — you grab an opponent's missed shot. These end a defensive possession.
Their sum gives rebounds per game (RPG). But the real question is the rebounding percentage: out of every rebound available while you were on the floor, how many did you grab? This is the metric analysts use in the NBA, and it becomes accessible as soon as a tool can track your minutes and the game totals.
A 6'3" forward who grabs 35% of available rebounds is, proportionally, more productive than a 6'11" big who grabs 30%. Size alone is not everything — positioning, anticipation, and want-to matter just as much.
Assists: measuring creation
An assist is credited when your pass leads directly to a made basket, without additional dribbling by the receiver (the exact rule varies by league, but the spirit is the same). It is the stat that measures your ability to create for others.
Two derived indicators are particularly useful:
- Assist-to-turnover ratio (A/TO) — you want it above 2 for a point guard, above 1.5 for a wing creator.
- Assists per possession — fairer than per-game numbers when minutes vary.
A point guard who dishes out 6 assists and rarely shoots can have more impact than a point guard averaging 4 assists but 5 turnovers per game. Always read both numbers together.
Steals, blocks, and defense
Individual defensive stats have historically been under-represented. For a long time we mostly tracked steals (STL) and blocks (BLK) because they are the only defensive actions easily observable by a scorekeeper.
They are useful stats, but watch out for the traps:
- A player who gambles for steals may wreck the team defense when he misses.
- A flashy block that flies out of bounds is worth less than a block that ends in a recovered possession.
- Zero blocks does not mean bad defense: a big who simply deters drives does an enormous defensive job that never shows in the box score.
That is one reason analysts started looking at finer measures like Plus/Minus, which tries to capture a player's overall impact on the score.
Shooting percentages: FG%, 3P%, FT%
Percentages are the most important face of offensive efficiency. There are three basic ones:
Field Goal Percentage (FG%)
Formula: FG% = made field goals / field goals attempted. This stat includes every field goal attempt, two-pointers and three-pointers combined.
A 45% FG% is considered solid for a perimeter player. A 55%+ FG% is what you expect from an interior player taking most of his shots in the paint. For a full walkthrough, read our dedicated article: How to calculate Field Goal Percentage in basketball.
Three-point Percentage (3P%)
Formula: 3P% = made threes / three-point attempts. A 35% 3P% is the generally accepted threshold for a shooter to earn respect. Below 30%, defenses will stop closing out on you beyond the arc.
Free-throw Percentage (FT%)
Formula: FT% = made free throws / free throws attempted. Free throws are the most "controllable" stat — no defense, no cardio fatigue, just routine. An FT% below 70% for a perimeter player is a red flag.
True Shooting Percentage (TS%)
To combine all three into a single efficiency number, analysts use the True Shooting Percentage, which accounts for the extra value of a three-pointer and for the fact that free throws do not consume a shot attempt. This one belongs to the advanced family, which we unpack in detail in our advanced stats guide.
Turnovers
Losing the ball hands the opponent a free possession. A turnover costs your team between 1 and 1.1 points on average, depending on the opponent's offensive efficiency. Tracking turnovers matters, especially for creators (point guards, ball-handling forwards).
Three types of turnovers to distinguish:
- Dribble turnovers — you get stripped while dribbling.
- Passing turnovers — your pass gets read and intercepted.
- Violations — travel, double dribble, backcourt, three-in-the-key.
Violations are often the easiest to fix because they are about discipline, not talent.
Basic stats summary table
| Statistic | What it measures | Good amateur target |
|---|---|---|
| Points | Scoring volume | Varies by role |
| Rebounds | Ball control after missed shots | 5+ off the point guard spot |
| Assists | Creating for teammates | 3+ for a point guard |
| Steals | Reading the opposing offense | 1+ per game |
| Blocks | Rim deterrence | 0.5+ for an interior player |
| FG% | Overall shooting efficiency | 45%+ |
| 3P% | Efficiency beyond the arc | 33%+ |
| FT% | Free-throw efficiency | 70%+ |
| Turnovers | Wasted possessions | Under 3 per game |
Advanced statistics: going further
Basic stats give you a first snapshot. Advanced stats give you understanding. They adjust raw numbers for minutes played, pace of play, and opponent quality. They let you fairly compare players who do not share the same minutes or the same role.
The main advanced stats are:
- PER (Player Efficiency Rating) — the reference composite score.
- True Shooting % (TS%) — real shooting efficiency.
- Usage Rate — the share of possessions you consume.
- Box Plus/Minus (BPM) — an impact score per 100 possessions.
- Win Shares (WS) — wins attributable to a player.
Each deserves a proper walkthrough: that is the subject of our dedicated article, Advanced basketball stats explained simply.
How to track your stats day to day
For an amateur player, three approaches exist:
- The paper notebook — reliable, slow, impossible to aggregate.
- The spreadsheet — better, but tedious to fill game after game.
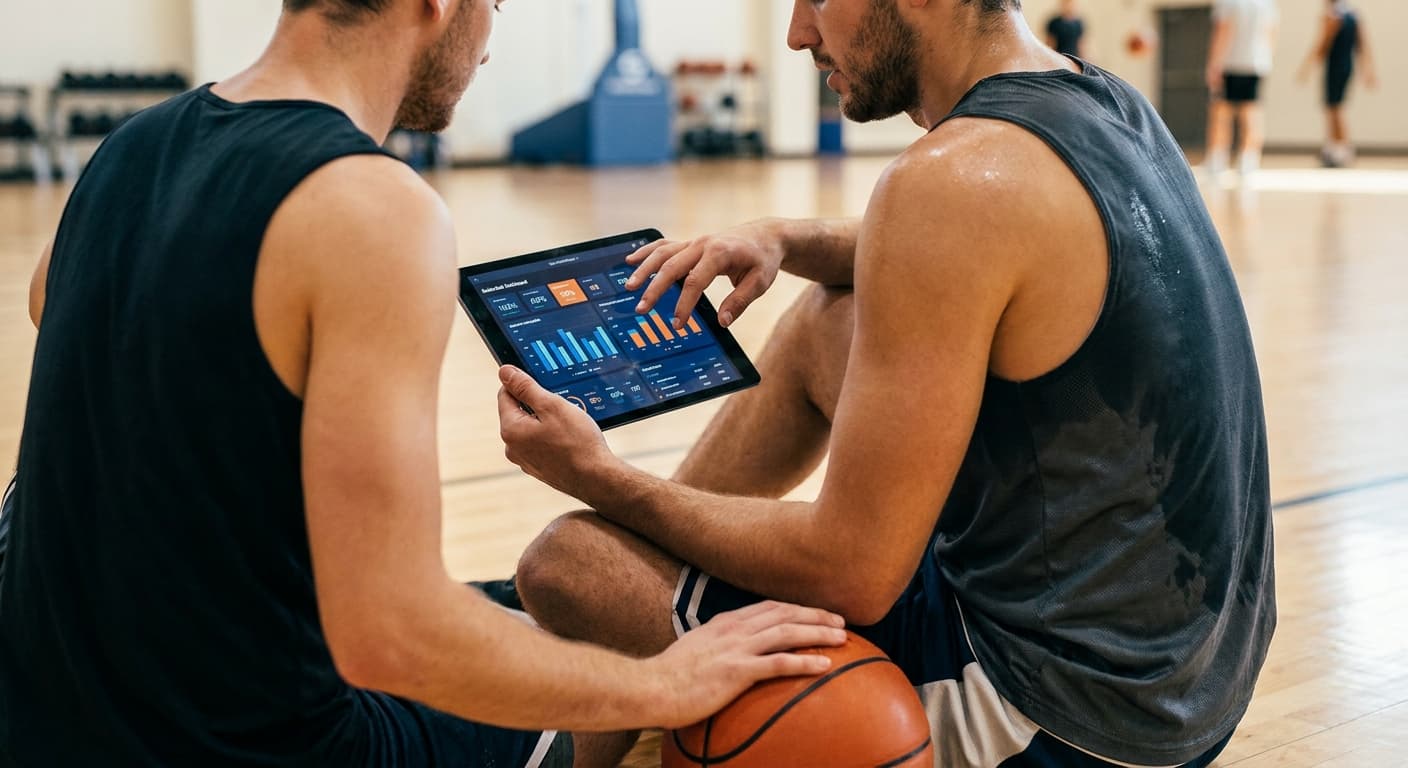
- A dedicated app like HoopsTrackR — you log your games, the app computes your averages, your trends, your shooting percentages by zone, and shows you your progress over time.
The advantage of a digital tool is continuity. You can compare October to March, see if your defense improved after changing teams, and identify the games where you perform best based on time, venue, or opponent.
Which stats to prioritize by position
You do not need to measure everything at once. Here is a pragmatic priority list:
- Point guard (position 1) — assists, A/TO ratio, FG%, 3P%, turnovers.
- Shooting guard (position 2) — points, 3P%, FT%, TS%.
- Small forward (position 3) — points, rebounds, FG%, 3P%, turnovers.
- Power forward (position 4) — rebounds, FG%, blocks, turnovers.
- Center (position 5) — rebounds, FG%, blocks, free throws attempted.
Start with these 4 to 5 stats over 10 games. Patterns that really concern you will emerge quickly.
Going deeper
You just read the general overview. To go further, three reference articles:
- How to calculate Field Goal Percentage (FG%) in basketball — the formula, worked examples, what a good FG% looks like, how to improve it.
- Understanding Plus/Minus (+/-) in basketball — the stat that tries to measure real impact, with its strengths and limits.
- Advanced basketball stats explained simply — PER, TS%, Usage Rate, BPM, Win Shares, with formulas and concrete examples.
Keep one simple rule in mind: statistics are only useful if you look at them regularly and turn them into concrete actions. A number that changes nothing in your training is a useless number. Conversely, tracking your FT% weekly and fixing your shooting routine can add 8 to 10 percentage points in a single season. That is the difference between a player who stagnates and a player who improves.
Frequently Asked Questions (FAQ)
What are the most important basketball stats?
It depends on position. For a point guard: A/TO, FG%, 3P%, turnovers. For a big: rebounds, FG%, blocks, free throws attempted. The universal efficiency indicator is True Shooting %.
How many games are needed for a reliable average?
Count 8 to 12 games minimum for averages to stabilize. Below that, variance is too high to draw conclusions.
Classic stats or advanced stats — which first?
Start with the 6 basics (points, shots, rebounds, assists, turnovers, fouls) over 10 games. Once averages settle, add TS%, Usage Rate, and A/TO.
Is it really useful at the amateur level?
Yes. Without a pro club's resources, your stats are your best self-evaluation tool. They pinpoint what works and what does not.
How to track without making life complicated?
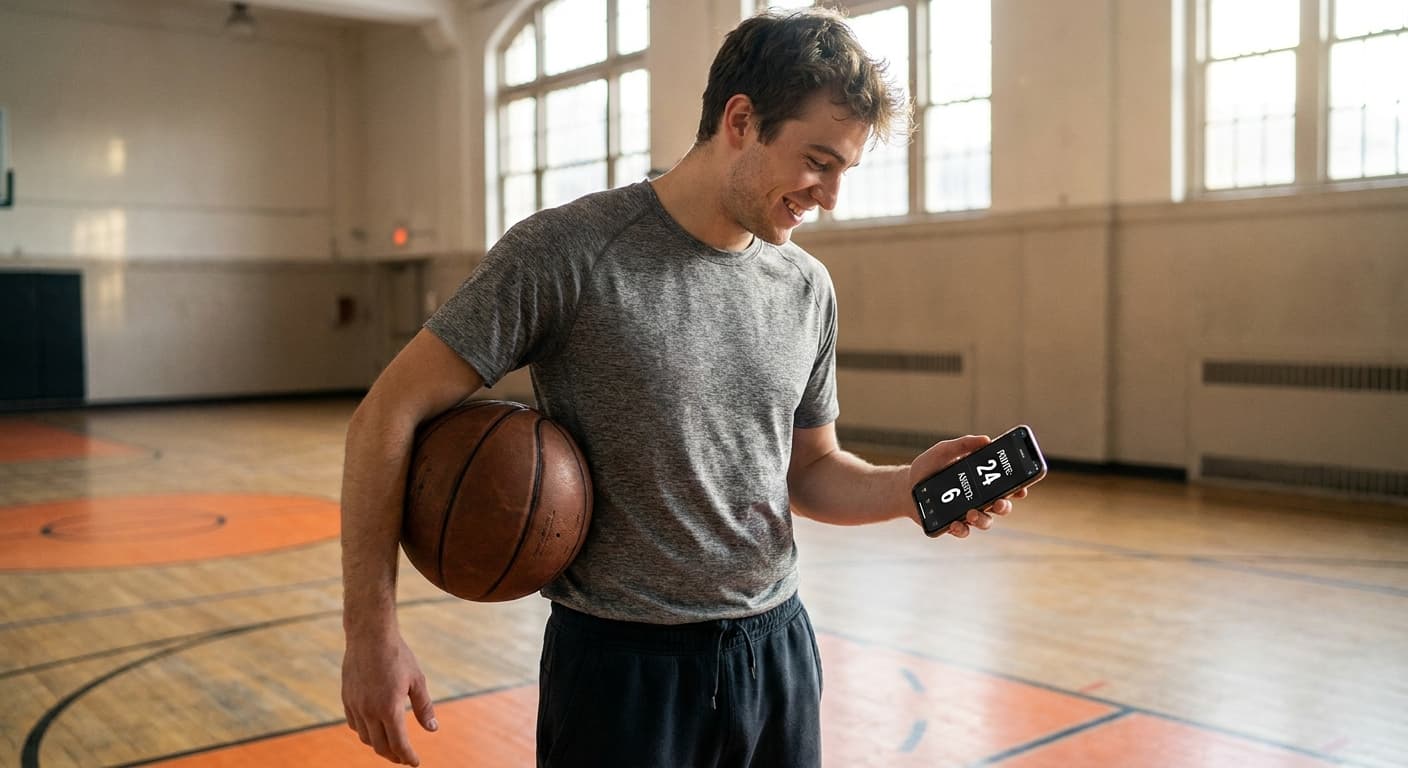
A tracking app like HoopsTrackR avoids spreadsheets. You enter stats in 30 seconds after each game and the app computes everything.
Level up with HoopsTrackR
You now have all the keys. Let's be honest: logging stats by hand is tedious. HoopsTrackR does the math for you and shows your progress over time.
You might also like

Improve Your Free Throws: From 60% to 80% in 6 Weeks
The free throw is the only fully controllable shot in basketball. The BEEF method, a pre-shot routine, 4 drills and a 6-week program to go from 60% to 80%.
Basketball turnovers: 7 techniques to reduce them
Turnovers cost roughly 1 point per possession. The 3 main types, 7 techniques to reduce them, and the tracking pattern to use.
Beginner guide: how to start tracking your basketball stats
You want to track your basketball stats but don't know where to start? This beginner guide shows you what to measure, how often, which tools, and the mistakes to avoid.